Scientific Education and Understanding of Human Mind
Scientific education and in particular education of mathematics was always a very important topic for me. In this research project, we try to use mathematical models, computer tools, and our teaching experience to improve education and understanding of students.
Teaching Experience
I started being a teaching assistant at Charles University already during my bachelor's degree studies, so I am teaching for 9 years. I was a teaching assistant for various undegraduate subjects: programming, discrete mathematics, combinatorics, graph theory, mathematical analysis, and linear algebra. A teaching assistant at Faculty of Mathematics and Physics of Charles University works with groups of 15-20 students and is free to organize the class, so it is at the same time very challenging and time consuming.
For six years, I was teaching special honors recitations in linear algebra, for most gifted freshmen students of computer science. We were not much concerned with problem solving, but instead we were discussing definitions, creating our own proofs of main results and trying to get as good understanding of linear algebra as possible. For the second semester, we have created our own lecture notes (in Czech). For several years, I was working on a draft of my book about introductory linear algebra (in Czech).
I was also teaching my own advance courses for bachelor's and master degree students. In Fall 2013 and Fall 2015, I was teaching the course Advance Linear Algebra which covers the following topics:
- Applications of eigenvalues and positive definite matrices.
- Introduction to numerical linear algebra: problems with round-offs, condition numbers, iterative algorithms.
- Matrix decomposition (QR, spectral decomposition, SVD).
- Overview of basic iterative methods to solve linear systems: splitting methods, the conjugate gradient method.
- Overview of basic methods for finding eigenvalues: QR method, divide and conquer.
In Spring 2016, I was teaching the course Complex Analysis via Visual Method based on an excellent book Visual Complex Analysis. It covered topics such as analytic functions, complex derivatives and integration, connection to vector fields and flows and work from physics, geometric interpretation of Cauchy theorem and residue theorem.
Also, for several years, I was teaching a seminar called Philosophy of Mathematics to small groups of biology/chemistry students at Nature Science Faculty of Charles University. I was trying to explain them key concepts such as problem solving, mathematical modeling, probability and statistics, etc. It was a very enriching experience because I had to find how to explain these topics as simply and clearly as possible. Around 2011, I made several experimental video lectures in mathematics, available at youtube.com.
In general, I was very lucky for many exceptional students. I have supervised bachelor's thesis and master's thesis of excellent student Peter Zeman who is currently a PhD student at Department of Applied Mathematics, Faculty of Mathematics and Physics, Charles University. Together, we have worked on the research project Symmetries and Graph Isomorphism linking symmetries of graphs and geometric representations.
Three Parts of Education
Our theory distinguishes three different parts of education, illustrated on mathematics:
- Local details - precise knowledge of definitions, results, proofs.
- Craft - skills for problem solving, application of algorithms and procedures such as matrix manipulations, calculus computations, etc.
- Global view (Big Picture) - connections between main ideas, how they relate to each other, motivations: why are the results important.
Inspired by numerical mathematics, we distinguish two natural approaches how global view is build:
- The direct method is based on gathering a lot of local details, then putting them together (sort of automatically) into a global view.
- The iterative method makes a global view in parallel with learning local details, and it is always updated and changed.
Mind-modelling Tool Orgpad
Not much was changed in last 5000 years in writing and sharing ideas. We still use linear sequences of pages, sentences and words called the linear form; just tools and distribution have been simplified. We propose structural diagrams which describe the main ideas and their connections. Using a computer tool Orgpad, it is very easy to construct, browse and modify the diagrams. Also, their visualization can be dynamically changed based on the current focus. Our experimental tool Orgpad, runs as an HTML website, so everyone can easily access it.

An example of a structural diagram of introductory linear algebra.
A list of my structural diagrams for teaching and research is available here. It includes the following diagrams:
- Introductory linear algebra - made for my classes, a more updated version is available in Czech.
- Visual Complex Analysis - made for my course, displaying the key connections between complex derivatives, integrals and physics.
- Structural Diagram for CV - an experiment, giving overview of my research and other academic activities.
- Geometric Representations of Graphs - overview of my PhD thesis, used as a presentation during its defence.
Aside the tool, we also study the methodology how to build and share understanding of global view of complex topics. It is based on mathematical modelling and we use results from biology and neurosciences. For instance, visualization is very important because ears work in one dimension: they capture a sequence of sounds, corresponding to words and sentences. Books consist of written sequences for ears. Eyes on the other hand work in two dimensions: they can jump back and forth in a visualization. This explains why a picture is sometimes worth a thousand of words. We use visualization to share the Big Picture. The methodology of using our tools is essential: there are many tools which could be used to draw similar diagrams, but our usage of diagrams is unique.
Also, I am working with Tomáš Bílý on a new version of Orgpad. An experimental build is available at orgpad.org, a more user-friendly version should be available in early 2018.
Experiment in Education of Big Picture
From 2015 to 2017, we are working on an experiment in education of linear algebra whose goal is to improve students' understanding of Big Picture. We have been testing structural diagrams in an educational experiment at Charles University in freshmen courses of linear algebra for computer science students. While our experiment concentrates on linear algebra and mathematics, we believe many findings are applicable for general education as well. Some preliminary findings were presented in 7th European Congress of Mathematics 2016 [1].
We tried teaching using the introductory linear algebra diagrams in my recitations for honors students. The first impressions of students are that it is too complicated and they will never be able to understand it. But after three or four lectures using the same diagram, they start to make sense of the basic structure. Several students prepared similar diagrams themselves, and some students used only the diagram instead of lectures and lecture notes to successfully prepare for the exam.
We have modified examination to include an oral part concentrating on Big Picture. Each student got one big topic such as matrices, linear mappings, or eigenvalues, and should prepare an overview of this topic on a paper. After that, the student discussed the understanding with an examiner for about 30 minutes. We have collected the data for about 200 students examined in this way. After the exam, each student filled a questionnaire ranking the method.
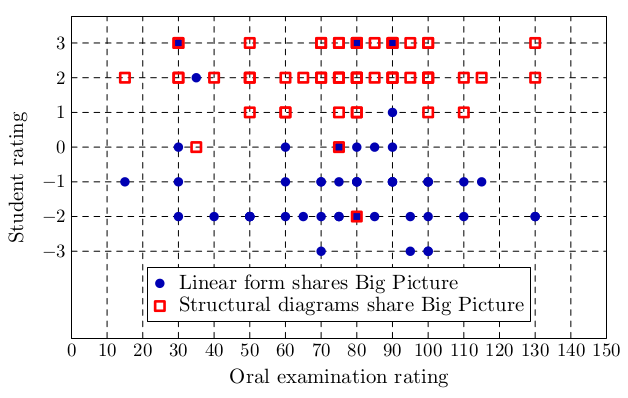
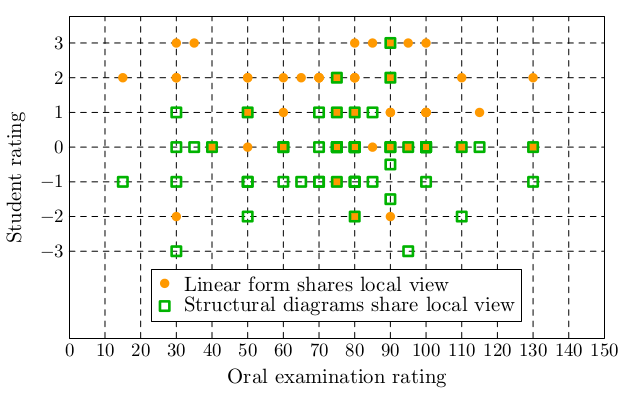
Further, we tested two approaches how to share Big Picture. Each student produced the overview of a topic in one of two randomly chosen forms:
- Linear form - a linear sequence of definitions, statements, proofs, examples, as in a standard mathematical book.
- Structural diagram - a diagram covering the main definitions/ideas and their connections within the topic.

|

|
|
|
|
|
Both examiners and students agree that the structural diagram naturally focuses more on connections in the topic, while the linear form is more concerned with local details. Students also appreciated the exam is not very random (one topic randomly selected from 5 or 4 topics in total) and that the examiners spend a lot effort trying to find out how students understand the topics. A few students mentioned that they would prefer similar exams in other mathematical subjects at the faculty.


The opinion of students about the method, based on the data collected in Spring 2016.


The opinions of students are not biased by their score in the oral examination.
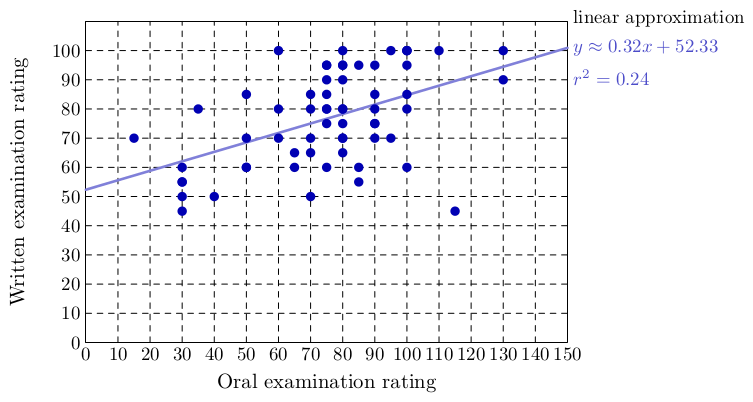
The examination also consisted of a written part concerned with local details and craft. For instance, the students were asked to write a definition, a statement, a proof, or to compute some problem with matrices. It is an interesting finding that there is a small correlation between the ranking in the written part (local details and craft) and in the oral part (global view). One possible conclusions is that the oral part examines something very different, and thus should not be abolished.

Comparison of ratings of students in the written and the oral part of the exam.
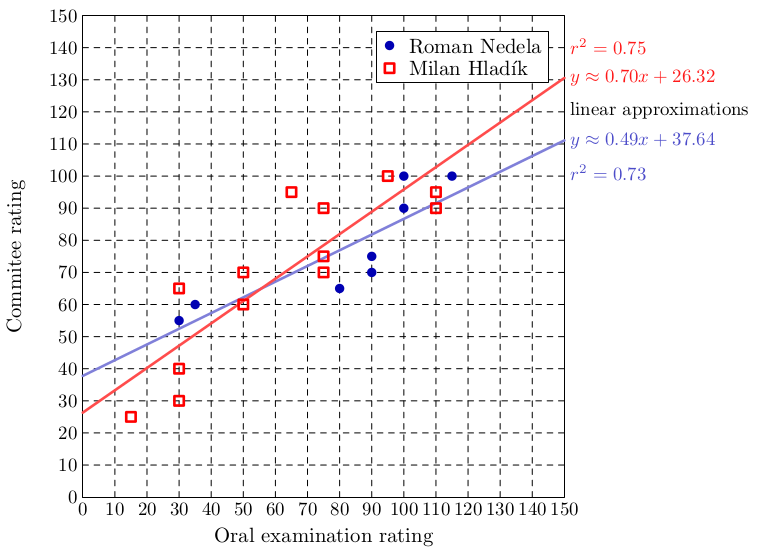
Also, to validate our ranking in the oral part, two mathematicians Milan Hladík and Roman Nedela produced as arbiters independent ranking of some students. There was a strong correlation between our ratings.

Comparison of examiners and arbiters ratings for randomly selected students.
Currently, we analyse the collected data and prepare a journal publication about our findings.
Presentations
- Pavel Klavík, Jiří Šejnoha, and Zdeněk Hedrlín: Big Picture of Mathematics: Experiment in Education, 7th European Congress of Mathematics 2016. Orgpad.